Ringside: Half of California’s Energy Comes from Crude Oil – California Globe
 |
| California Energy Consumption by Source, 2021 |
Quick Facts
- In 2022, California was the seventh-largest producer of crude oil among the 50 states, and, as of January 2022, the state ranked third in crude oil refining capacity.
- California is the largest consumer of jet fuel and second-largest consumer of motor gasoline among the 50 states.
- In 2020, California was the second-largest total energy consumer among the states, but its per capita energy consumption was less than in all but three other states.
- In 2022, renewable resources, including hydroelectric power and small-scale, customer-sited solar power, accounted for 49% of California's in-state electricity generation. Natural gas fueled another 42%. Nuclear power supplied almost all the rest.
- In 2022, California was the fourth-largest electricity producer in the nation. The state was also the nation’s third-largest electricity consumer, and additional needed electricity supplies came from out-of-state generators.
Ringside: Half of California’s Energy Comes from Crude Oil – California Globe
Here’s a reality check that ought to keep politicians up at night in California. Despite being a sunny, solar friendly state, with ample areas blessed with high wind, California still derives 50 percent of its total energy from crude oil. Another 34 percent comes from natural gas. This fossil fuel total for California energy, 84 percent, actually exceeds the world average for 2022, which – including coal – came in at 82 percent.
These figures come from the U.S. Energy Information Administration report “California Energy Consumption Estimates – Consumption by Source” for 2021, which is the most recent year for which data is posted.
To verify this data, which was mildly surprising, I turned to a separate EIA report, produced in conjunction with Lawrence Livermore National Laboratory, “California Energy Consumption in 2021.” To digress, this flowchart yields fascinating insights, because it shows fuel inputs on the left, then, moving from left to right, shows which inputs are directed towards electricity generation, then shows how these inputs all flow into the four primary sectors of California’s economy – residential, commercial, industrial, and transportation – and finally, on the right, depicts how much of the energy going into each sector is consumed in the form of actual energy services (traction, heating, cooling, pumping, powering, etc.) and how much is “rejected energy” lost to heat and friction. Grok that chart and you’re on your way.
To digress even more, for those who actually click on this revealing chart, you must note that the “non-thermal energy inputs,” on the chart are artificially inflated. The reason for this is explained in the lengthy footnote, where about halfway through you will read that “EIA reports consumption of renewable resources (i.e., hydro, wind, geothermal and solar) for electricity in BTU-equivalent values by assuming a typical fossil fuel plant heat rate.”
In plain English, this means whatever is reported as an input from these renewable sources is 2.5 times what they actually generated, based on the assumption these renewables are displacing that quantity of thermal fuel which on average only converts into energy services at a rate of 40 percent. Yes. They really do this. It’s standard practice. Absent a nuanced interpretation it overstates the contribution of renewables to California’s energy supply can be misleading.
Once those renewable inputs are normalized, the contribution of crude oil to California’s total energy consumption came out to nearly exactly the same value, 51 percent. Therefore from two authoritative sources we get the same result: half the fuel Californians rely on to power their civilization comes from crude oil. And yet California’s state Legislature has declared war on oil, along with natural gas. And here, it gets even more interesting.
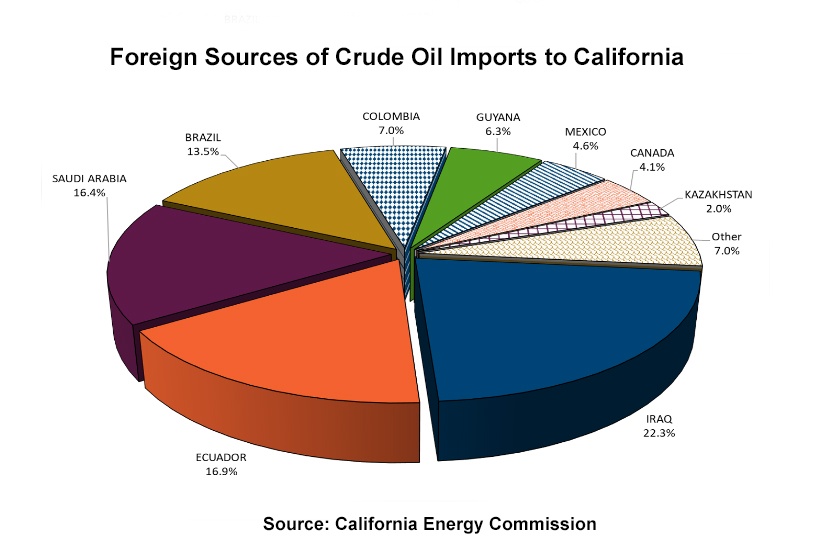
Also relying on EIA statistics, but turning to another chart “California Energy Production Estimates, 2021,” it is possible to determine how much oil and natural gas is produced in-state. The numbers are shocking. Californians import 93 percent of their natural gas, and 76 percent of their crude oil. Here’s a pie chart “Foreign Sources of Crude Oil Imports to California,” courtesy of the California Energy Commission showing where it comes from: Iraq 22.3%, Ecuador 16.9%, Saudi Arabia 16.4%, Brazil 13.5%, Colombia 7%, Guyana 6.3%, Mexico 4.6%, Canada 4.1%, faraway Kazakhstan 2.0%, and assorted other nations, another 7 percent.
Since half of California’s energy comes from oil, it’s easy to quantify the impact if problems arise with the supply from any of these nations. More to the point, why aren’t we drilling here in California? Won’t our drilling practices be more environmentally responsible? And won’t it benefit the environment to not have dozens of oil tankers perpetually belching bunker fuel exhaust off the coast of Long Beach, and that only after they’ve belched their way across the Pacific Ocean? Even if Californians cut consumption of oil by 50 percent, we would still have to more than double our production of in-state oil before we’d eliminate imported oil.
Instead of recognizing that renewable energy technologies are not ready to pick up the slack, the state Legislature has taken further steps to end oil production in California. SB 1137, signed by Governor Newsom in 2022, creates “health protection zones” within 3,200 feet of any “sensitive receptor,” i.e., any establishment open to the public or any residence. Fighting for its life, the industry has qualified a referendum on SB 1137 that will be on the state ballot this November.
The practical impact of this will not only be to ban most future drilling, but also impose restrictions (and invite lawsuits) that will compel the shutdowns of existing wells. The big alleged problem? The unhealthy air quality caused by methane leaks from these wells. But methane is lighter than air, meaning whatever minor leakage may occur at any of California’s strictly monitored wells will quickly dissipate upwards.
Perhaps we may fulminate over the supposed climate impact of releasing methane into our atmosphere. But exporting that problem to other nations where wells will be even more prone to methane leakage is not a moral choice. It just kills good jobs right here in California.
California consumes 1.8 million barrels of oil per day, but only produces 463,000 barrels per day. In 1986, its production peak, California produced 1.1 million barrels per day. The state did not run out of oil and gas reserves. The industry ran into the regulators.
What California’s policymakers have not come to terms with is we are importing nearly everything relating to energy production in California. Not just crude oil and natural gas, but wind turbines and blades, photovoltaic panels, and batteries. How is this considered sustainable? We have created a regulatory environment in California where it is nearly impossible to dig, drill, develop, mine, log, graze grow, or manufacture anything.
California’s energy producers, water agencies, and farming interests need to unite to promote a new agenda for the state that puts people first. They have to be willing to compete on price in a more rational and less hostile business environment. At the same time, they must find a way to share a policy agenda that restores the ability for private companies to produce and sell affordable goods and services at a profit, and without subsidies.
New Data Shows Growth in California’s Clean Electricity Portfolio and Battery Storage Capacity
For Immediate Release : May 25, 2023
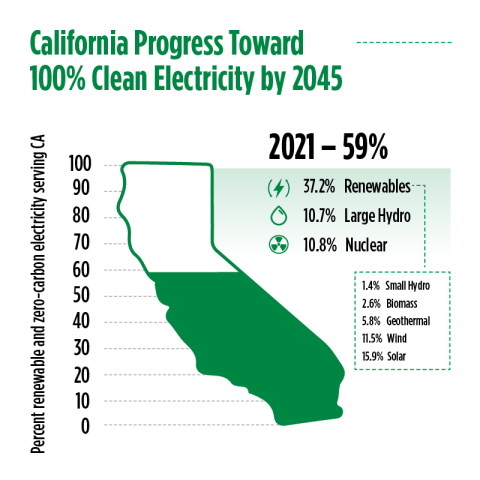
SACRAMENTO – The latest data from the California Energy Commission (CEC) shows that in 2021 more than 37 percent of the state’s electricity came from Renewables Portfolio Standard (RPS)-eligible sources such as solar and wind, an increase of 2.7 percent compared to 2020.
When combined with other sources of zero-carbon energy such as large hydroelectric generation and nuclear, nearly 59 percent of the state’s retail electricity sales came from nonfossil fuel sources. This amount remains unchanged from 2020 despite the jump in renewables due to drought-related declines in hydroelectric generation.
“This latest report card shows California continues making significant progress toward a 100 percent clean electrical grid of the future that leaves dirty fossil fuels in the past,” said Commissioner Noemí Gallardo, who is the lead commissioner on RPS compliance. “We remain committed to ensuring a healthier and prosperous future for all Californians. By removing barriers to new clean energy projects and funding energy innovations, we will help the state deliver on this vision by mid-century.”
California’s RPS program requires all load-serving entities in California to procure a portion of their electricity sales from eligible renewable resources. The program was established in 2002 with an initial requirement that 20 percent of electricity retail sales be served by renewable resources by 2017. Escalating requirements saw the goal increase to 33 percent by 2020 — a target that was met two years early in 2018.
Senate Bill 100 (2018) accelerates the RPS goal to 60 percent by 2030. The landmark policy also requires RPS-eligible sources and zero-carbon resources to supply 100 percent of California’s electricity retail sales and electricity procured to serve state agencies by 2045. To keep the state on track, last year Governor Gavin Newsom signed SB 1020 (2022), establishing interim targets of 90 percent clean electricity by 2030 and 95 percent by 2040.
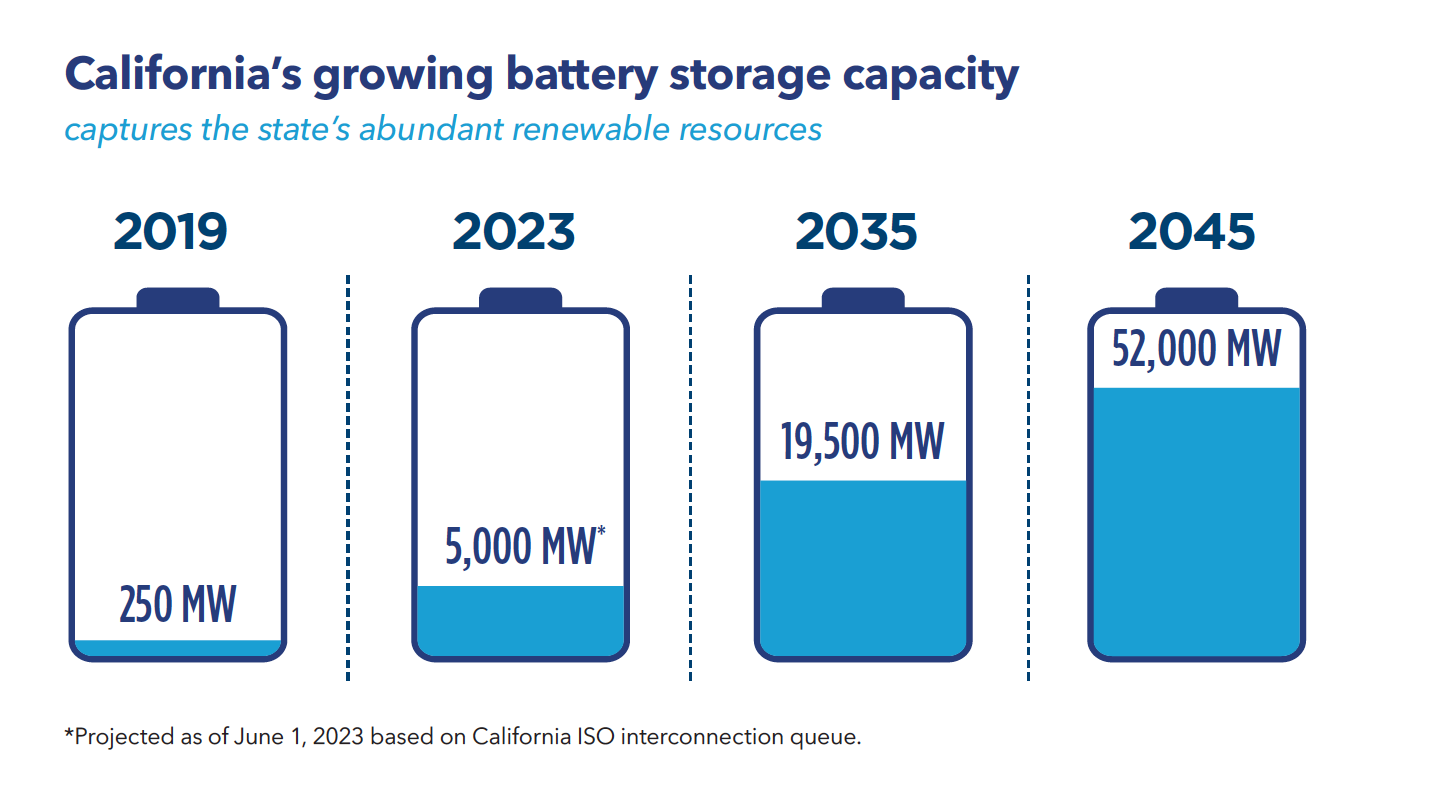
Battery Storage Build-Out Reaches Milestone
To complement California’s abundant renewable energy resources, the state is focused on deploying energy storage. According to the California Independent System Operator, battery storage capacity has increased by nearly 20 times since 2019 — from 250 megawatts (MW) to 5,000 MW. Today’s fleet of storage resources can capture enough electricity to power up to 5 million California homes. By midcentury, capacity is projected to increase another 10 times to 52,000 MW.
New Interactive Data Dashboards Unveiled
To help visualize the state’s progress toward 100 percent clean electricity, the CEC has released a suite of new interactive tools with downloadable data on the following topics:
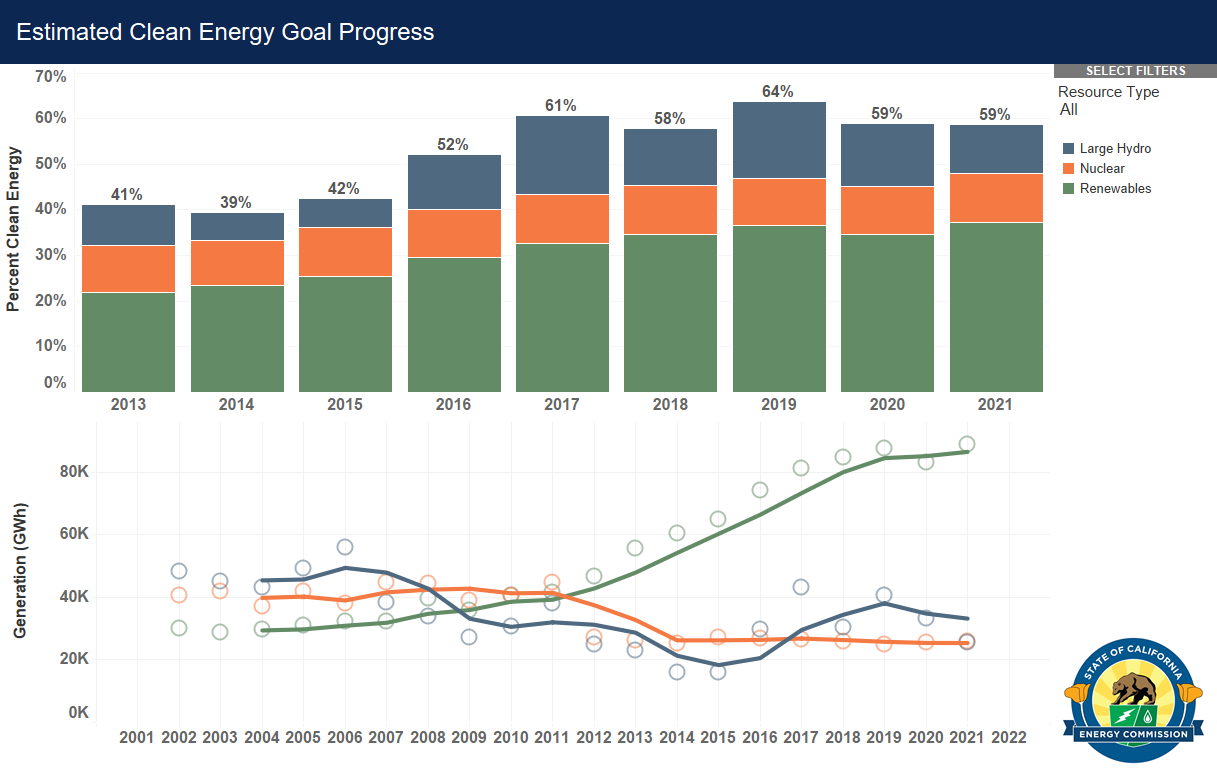
- Estimated Annual Clean Energy
- Estimated Annual Renewable Portfolio Standard-Certified Renewable Energy
- 2020 Renewable Portfolio Standard-Certified Renewables
- Historical Large Hydroelectric Generation
- Historical Nuclear Generation
The dashboards are part of CEC’s effort to modernize and improve accessibility to data products using cutting-edge technology. Other offerings include the Zero Emission Vehicle and Infrastructure Statistics dashboards.
###
About the California Energy Commission
The
California Energy Commission is the state's primary energy policy and
planning agency. It has seven core responsibilities: advancing state
energy policy, encouraging energy efficiency, certifying thermal power
plants, investing in energy innovation, developing renewable energy,
transforming transportation, and preparing for energy emergencies.


Comments
Post a Comment